
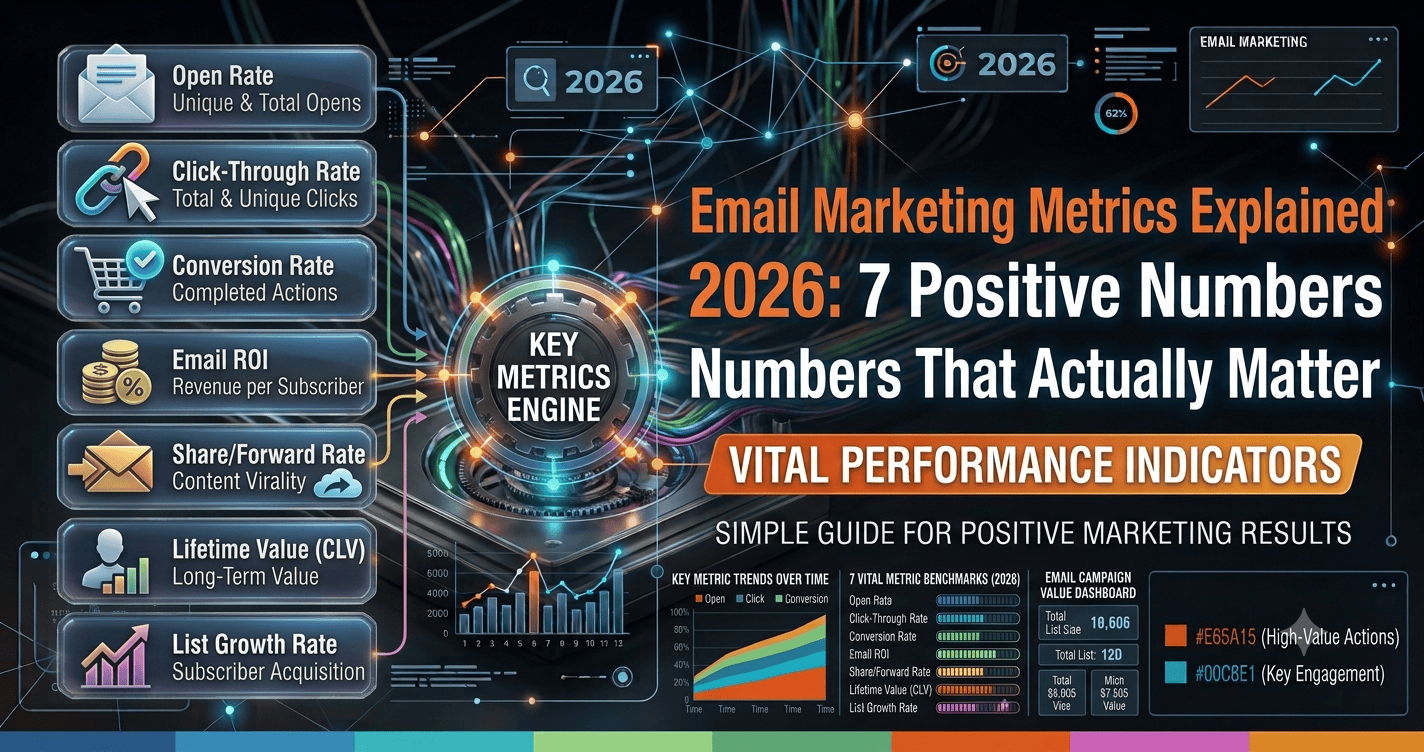
Your dashboard shows open rate, click rate, bounce rate, and a dozen other numbers u2014 but which ones actually tell you whether your email marketing is working?
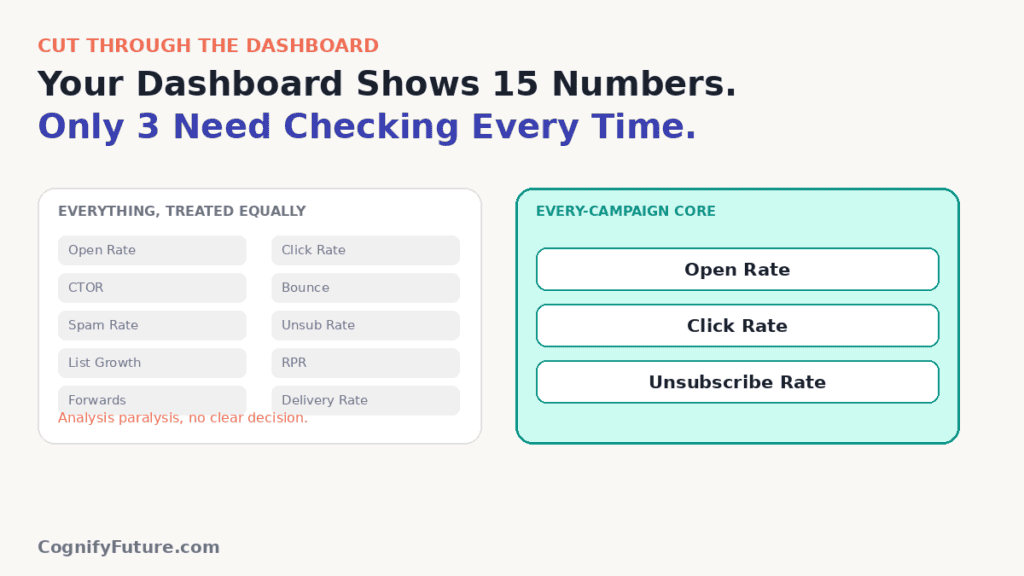
Most email platforms surface far more metrics than any one sender needs to act on regularly, and treating all of them as equally important is a fast way to spend time analyzing numbers that don’t change any decision you’d actually make. A small handful of metrics drive almost every meaningful decision in email marketing; the rest are useful for occasional diagnosis, not weekly tracking.
I went through Email Marketing Metrics what each metric actually measures, what’s considered healthy, and which ones deserve your regular attention versus occasional reference, to answer the questions that matter:
- What does each major metric actually measure, in plain terms?
- What’s a healthy benchmark, and when should a number worry you?
- Which metrics should you check every campaign vs occasionally?
- How has privacy-related tracking changed what these numbers actually mean?
Short answer: open rate, click rate, and unsubscribe rate are your core, every-campaign metrics. Bounce rate and spam complaint rate matter for deliverability health and are worth a periodic check rather than obsessive monitoring. Revenue per recipient (if you sell anything) ties performance to actual business outcomes, not just engagement. Below, I’ll define each metric clearly and give realistic benchmarks.
Open Rate
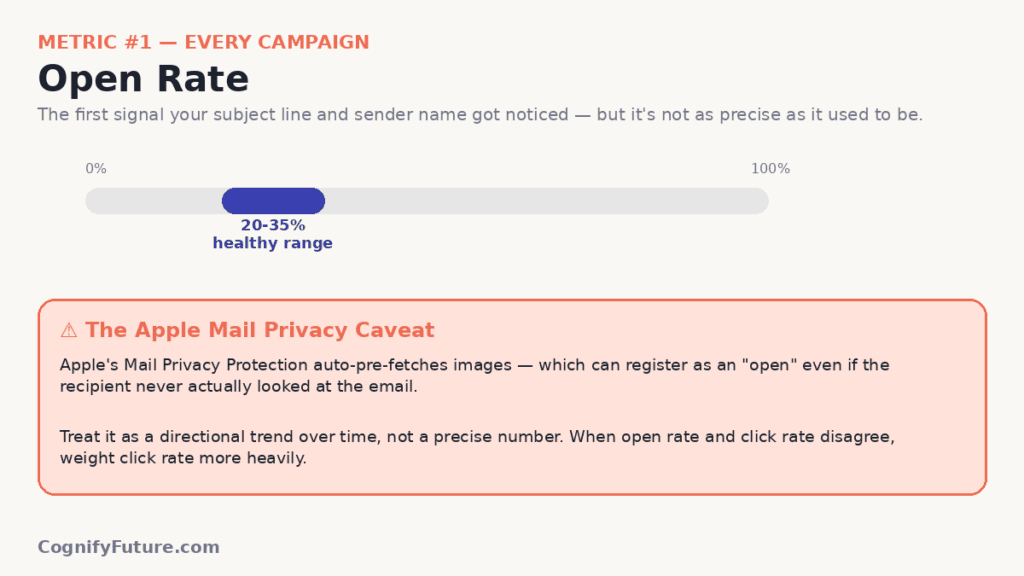
What it measures: the percentage of delivered emails that were opened. It’s the first signal of whether your subject line and sender name are compelling enough to get noticed in a crowded inbox.
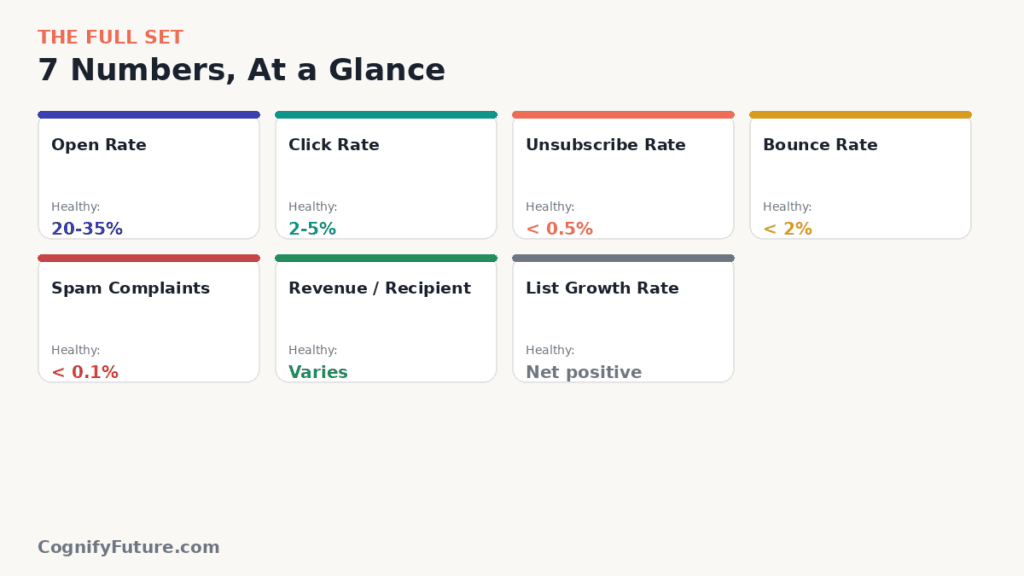
What’s healthy: this varies considerably by industry and list type, but a general range of 20-35% is common for engaged lists, with automated and triggered emails (welcome sequences, abandoned cart flows) typically running notably higher than regular broadcast campaigns, since they reach subscribers at a moment of higher relevance and demonstrated intent.
Important caveat: open rate has become a less precise metric since some email clients (notably Apple’s Mail Privacy Protection) automatically pre-fetch images, which can register as an “open” even if the recipient never actually looked at the email. This doesn’t make open rate useless, but it means treating it as a directional trend over time rather than a perfectly precise number, and weighting click rate more heavily when the two seem to disagree.
Click Rate (or Click-Through Rate)
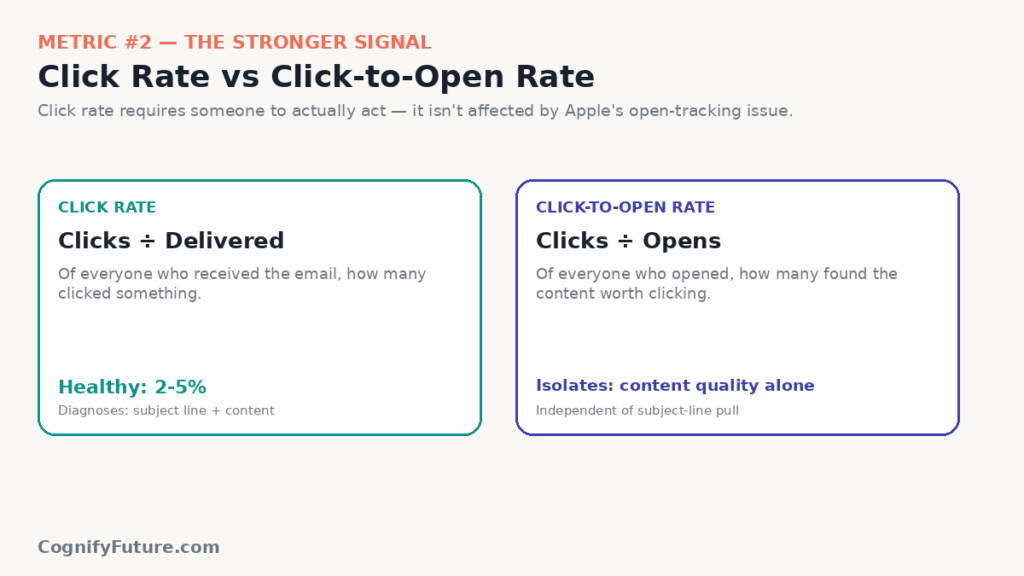
What it measures: the percentage of delivered emails where the recipient clicked at least one link. This is a stronger signal of genuine engagement than open rate, since it requires the recipient to have actually read or scanned the content and found something worth acting on.
What’s healthy: typically lower than open rate by a meaningful margin, often somewhere in the 2-5% range for general campaigns, though this varies significantly based on content type and what action you’re asking for. A related metric, click-to-open rate (clicks divided by opens rather than by total delivered), isolates how compelling the actual content was for people who did open, independent of subject line performance.
Why it matters more than open rate for most decisions: if you’re trying to diagnose whether your email content itself is working, click rate (and especially click-to-open rate) is the more reliable signal, since it isn’t affected by the same privacy-related pre-fetching issue that complicates open rate.
Unsubscribe Rate
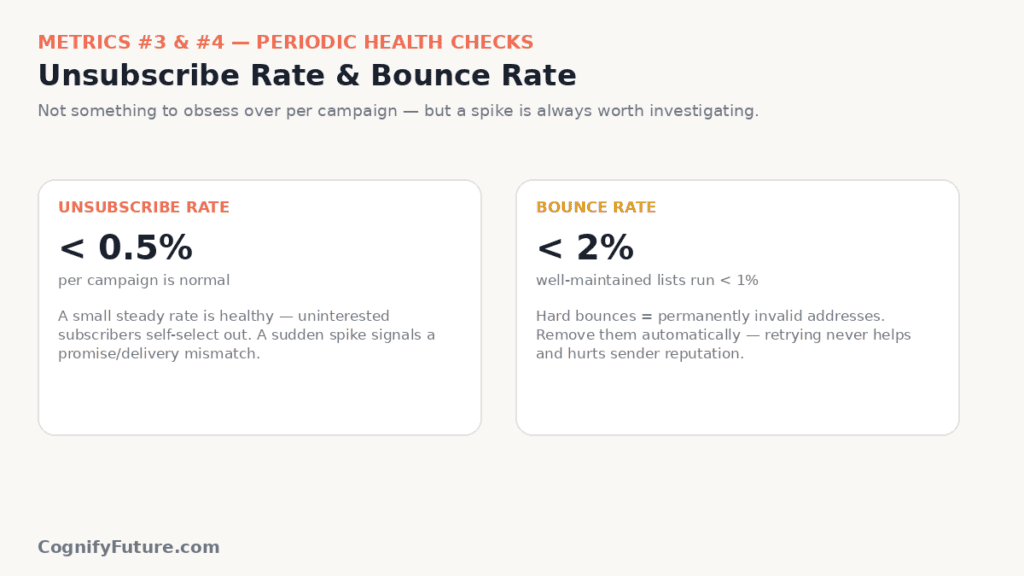
What it measures: the percentage of recipients who unsubscribed from a given email. A small, steady rate is normal and often healthy, since it usually means people who were never going to engage are self-selecting out of your list.
What’s healthy: generally under 0.5% per campaign is considered normal; a sudden spike well above your usual baseline on a specific campaign is worth investigating, since it often points to a mismatch between what was promised at signup and what was actually delivered, or a noticeable change in sending frequency or content type.
Why a slightly higher unsubscribe rate isn’t always bad: a list that’s actively shedding genuinely uninterested subscribers tends to show healthier engagement metrics overall, since the remaining list is more concentrated with people who actually want your content.
Bounce Rate
What it measures: the percentage of emails that couldn’t be delivered. Hard bounces (permanent failures, like a non-existent address) and soft bounces (temporary issues, like a full inbox) are usually broken out separately, since they signal different problems.
What’s healthy: generally under 2%, with most well-maintained lists running well below 1%. A consistently high bounce rate signals list hygiene problems u2014 outdated addresses that should be removed u2014 and can damage sender reputation if not addressed, since mailbox providers interpret a high bounce rate as a signal of poor list quality.
Action to take: hard-bounced addresses should generally be removed from your list automatically (most platforms do this by default) rather than retried, since a permanently invalid address will never become deliverable again.
Spam Complaint Rate
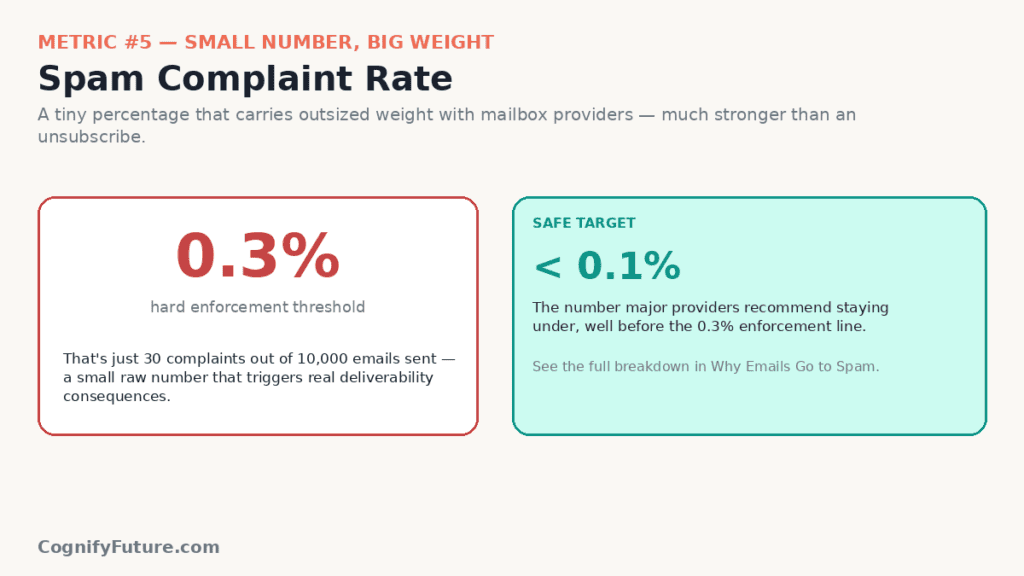
What it measures: the percentage of recipients who specifically marked your email as spam, as opposed to simply unsubscribing. This metric carries outsized weight with mailbox providers compared to its raw percentage size, since it’s a much stronger negative signal than an unsubscribe.
What’s healthy: well under 0.1% is the safe target recommended by major providers, with 0.3% generally treated as a hard threshold where enforcement and deliverability problems kick in. Because this threshold is calculated on relatively small numbers (30 complaints out of 10,000 emails is enough to hit 0.3%), it deserves more attention than its small percentage might suggest at a glance.
See our Why Emails Go to Spam in 2026 guide for the full detail on how this metric affects deliverability and what causes it to creep up.
Revenue Per Recipient (RPR)
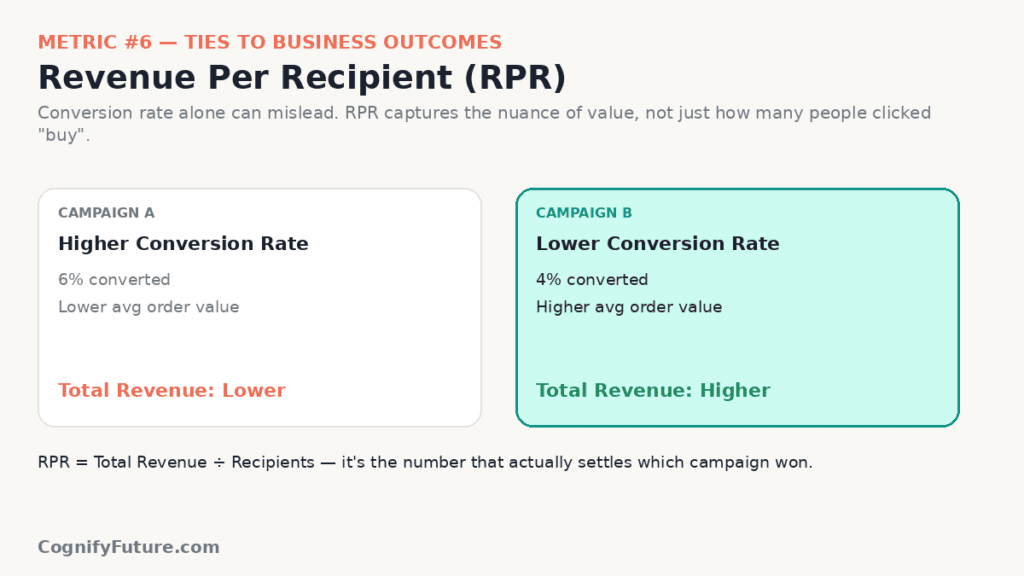
What it measures: the total revenue attributed to a campaign or automation, divided by the number of recipients. This ties email performance directly to business outcomes rather than just engagement, and is particularly relevant for ecommerce and any business with a direct purchase path from email.
Why it matters more than conversion rate alone: a campaign or flow with a slightly lower conversion rate but meaningfully higher average order value among converters can still generate more total revenue than one with a higher conversion rate but lower-value purchases. RPR captures this nuance, while conversion rate in isolation can be misleading when comparing campaigns with different audiences or offers.
Our Abandoned Cart Email Flow Guide 2026 covers RPR benchmarks specifically for one of the highest-performing automation types in this metric.
List Growth Rate
What it measures: how quickly your list is growing (new subscribers) relative to how quickly it’s shrinking (unsubscribes and removed inactive or bounced addresses). A list that’s growing in raw numbers but churning at a similarly fast rate isn’t actually building toward a larger, more valuable audience u2014 it’s treading water.
What to watch for: if growth and churn are roughly equal, the more useful question becomes why subscribers are leaving as fast as they’re joining, which often points to a mismatch between what new subscribers expect at signup and what they actually receive afterward.
Which Metrics to Check Every Campaign vs Occasionally
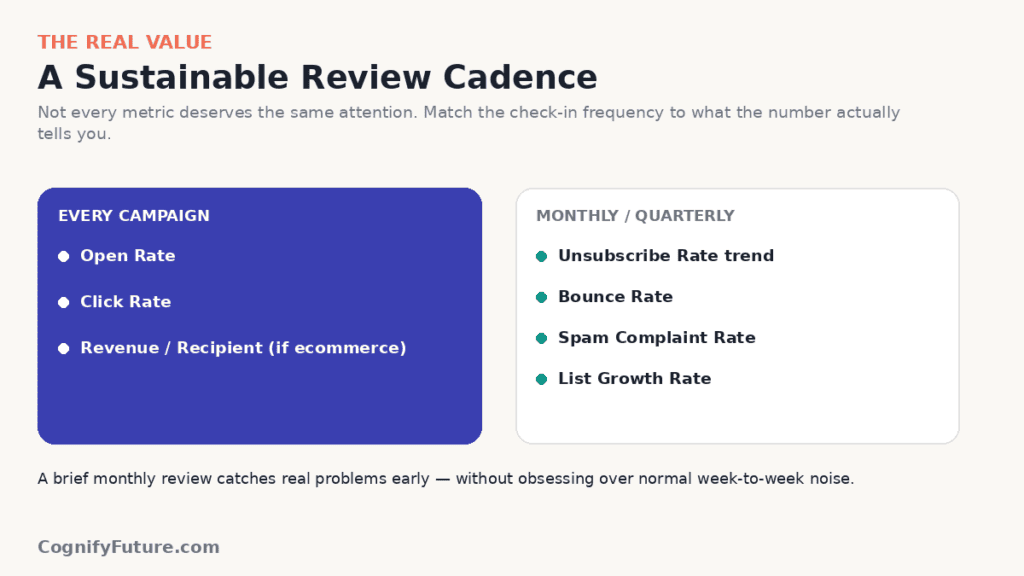
Every campaign: open rate and click rate, as your basic health check on subject line and content performance. For ecommerce or any revenue-driving campaign, also check revenue per recipient.
Periodically (monthly or quarterly): unsubscribe rate trends, bounce rate, spam complaint rate, and list growth rate. These matter more as ongoing health indicators than as something to scrutinize after every single send, since a single campaign’s bounce or complaint rate is usually too small a sample to draw conclusions from in isolation.
When something feels off: if engagement metrics suddenly drop or deliverability seems to be degrading, that’s the moment to dig into bounce rate, spam complaint rate, and authentication status specifically, since these are the metrics most likely to reveal a technical or list-quality cause behind a broader performance decline.
Practical Use Case: A Simple Monthly Metrics Review
Rather than checking every metric after every campaign, a more sustainable habit is a brief monthly review covering: average open and click rate trend across the month’s campaigns, unsubscribe rate trend, current bounce and spam complaint rate, net list growth, and (if relevant) total revenue per recipient across automated flows specifically.
This cadence catches meaningful trends and problems early without requiring obsessive day-to-day metric-watching that often leads to overreacting to normal week-to-week variation that isn’t actually signal.
Final Verdict
A small set of metrics drives almost every meaningful decision in email marketing: open rate and click rate for every-campaign health checks, unsubscribe and bounce rate as periodic hygiene indicators, spam complaint rate as a critical deliverability safeguard despite its small raw percentage, and revenue per recipient if you sell anything, since it ties performance to actual business impact rather than engagement alone.
Resist the urge to track every available number with equal attention. A simple, consistent monthly review of the metrics above will catch the problems and opportunities that actually matter, without the noise of obsessing over normal variation in numbers that don’t change any decision you’d actually make from one campaign to the next.
1. What is a good email open rate?
A general range of 20-35% is common for engaged lists, though this varies by industry and list type. Automated and triggered emails like welcome sequences typically run higher than regular broadcast campaigns, since they reach subscribers at a moment of higher relevance.
2. Why is open rate considered less reliable than it used to be?
Some email clients, notably Apple’s Mail Privacy Protection, automatically pre-fetch images, which can register as an open even if the recipient never actually viewed the email. This means open rate should be treated as a directional trend over time rather than a perfectly precise number.
3. What’s the difference between click rate and click-to-open rate?
Click rate is clicks divided by total emails delivered. Click-to-open rate is clicks divided specifically by opens, isolating how compelling the content was for people who already opened, independent of how well the subject line performed at generating opens in the first place.
4. What spam complaint rate should I be worried about?
Well under 0.1% is the safe target recommended by major mailbox providers, with 0.3% treated as a hard enforcement threshold. Because this is calculated on small numbers (30 complaints per 10,000 emails hits 0.3%), it deserves more attention than its small percentage might suggest.
5. Is a higher unsubscribe rate always bad?
Not necessarily. A small, steady unsubscribe rate often means genuinely uninterested subscribers are self-selecting out, which can improve overall list engagement. A sudden spike well above your usual baseline on a specific campaign is the more useful signal to investigate.
6. What is revenue per recipient and why does it matter?
Revenue per recipient (RPR) is total attributed revenue divided by number of recipients. It matters because a campaign with a lower conversion rate but higher average order value can generate more total revenue than one with a higher conversion rate but lower-value purchases, a nuance conversion rate alone misses.
7. Which email metrics should I check after every campaign?
Open rate and click rate are the core every-campaign metrics. For ecommerce or revenue-driving campaigns, also check revenue per recipient. Bounce rate, spam complaint rate, and unsubscribe rate trends are better suited to periodic (monthly or quarterly) review rather than per-campaign scrutiny.
8. What does a high bounce rate mean and what should I do about it?
A consistently high bounce rate (generally above 2%) signals list hygiene problems, typically outdated or invalid email addresses. Hard-bounced addresses should be automatically removed from your list, since a permanently invalid address will never become deliverable again.





I am Ashish Yadav a software engineer and AI tools researcher with over five years of practical experience working with real-world systems and automation. I am founder of CognifyFuture, where I analyzes, tests, and breaks down AI tools with a focus on what actually works—not what’s trending.
My content is built on hands-on usage, not theory. Instead of generic advice, I focuses on real implementation—how AI tools can be used to automate tasks, improve efficiency, and solve any specific business or individual problems.
Through CognifyFuture, My aims is to eliminate confusion around AI by delivering clear, honest, and actionable insights that help users make smarter technology decisions.